Tag Archives: data visualisation
Data Viz of the Week: Mike Bostock demos d3.js

Here in the Insights corner of Tempero Towers, we’re always looking for ways to improve the data visualisation aspects of our work. We’re particularly excited by the amazing work being done in the interactive space, which is why we’re giddy …
Posted in blog Tagged data, Data Management, data visualisation, insights, Mike Bostock Leave a comment
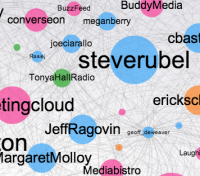
Top 200 Social Media Influencers in New York City

I’ve said it before and I’ll say it again: influence is the social media industry’s white whale. Every data scientist and pundit has had a crack at explaining it. You don’t have to trawl through our explanation of influence if …
Posted in blog Tagged analysis, connections, data, data visualisation, map, social media, social media influence, social media insights 2 Comments


